Human Resources Talent Planning
The Problem Statement
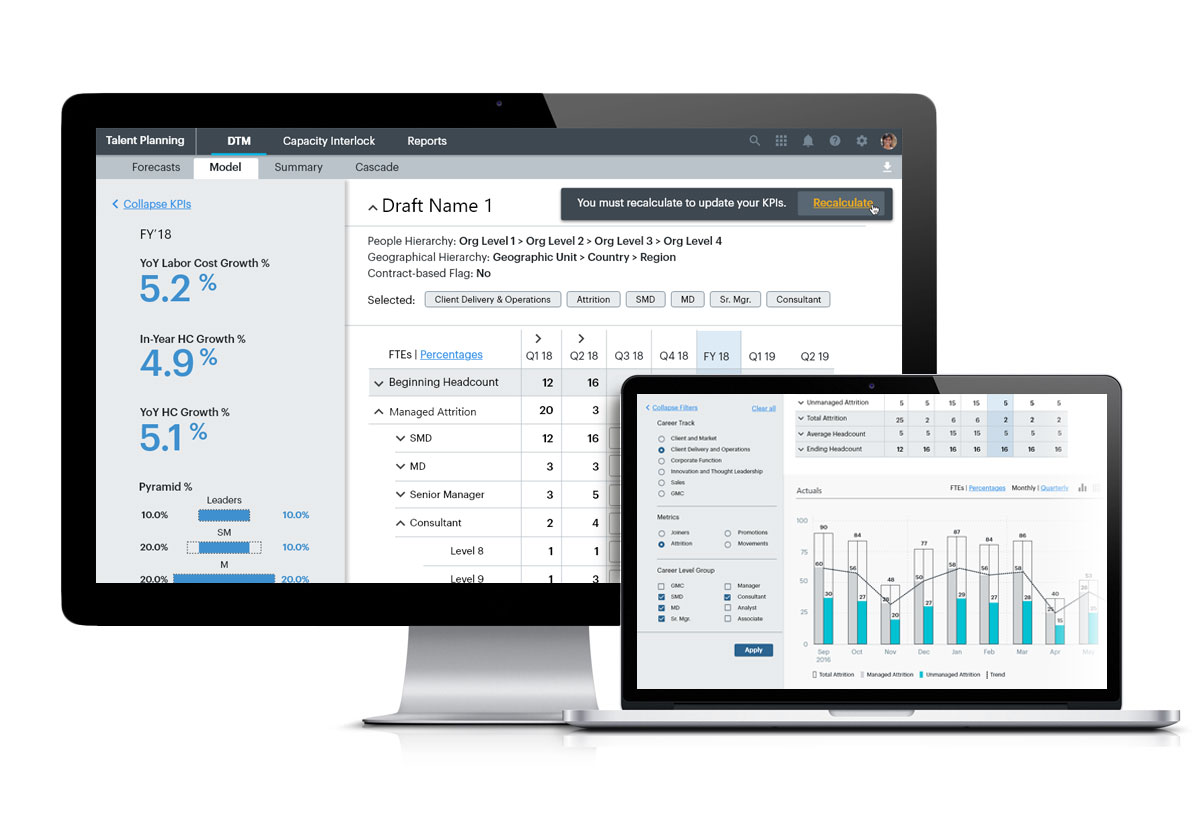
Human resource employees have a difficult time understanding current headacounts for a given office or region or even capability to understand suppy and demand relationships. Currently, HR users leverage offline spreadsheets in personalized non standard formats to track their focus areas.
This experience design not only impacted the digital appplication but also helped define the business units process and governance practices. UX and product worked directly with HR directors for North America while validating and shaping this experience.
Contributions
- UX strategy
- Persona development
- User stories
- User research
- Task analysis
- System flows
- Wireframes and mocks
- UI design - medium fidelity
Personas
The two major user types are forecasters and leadership.
- Forecaster User: Handles the data entry and reconciliation of forecasts. This user enters data, collaborates with colleagues on drafts, creates reports and pushes their updates upstream for leadership approval.
- Senior Leadership User: Business unit leads that use the tool to report and understand trends for their business. This user leverages the application to lead staffing initiatives and understand future headcount needs in the coming quarters.
Discovery
Users need a way to efficiently leverage data trends to inform headcount forecasting. These headcount forecasts can then be passed to the finance users for further budgeting investigation which impacts supply modeling. The following case study will focus on headcount forecasting aspects of the experience.
Users need a holistic experience that systematically combines supply and demand insights to empower leadership to more readily meet their global business targets.
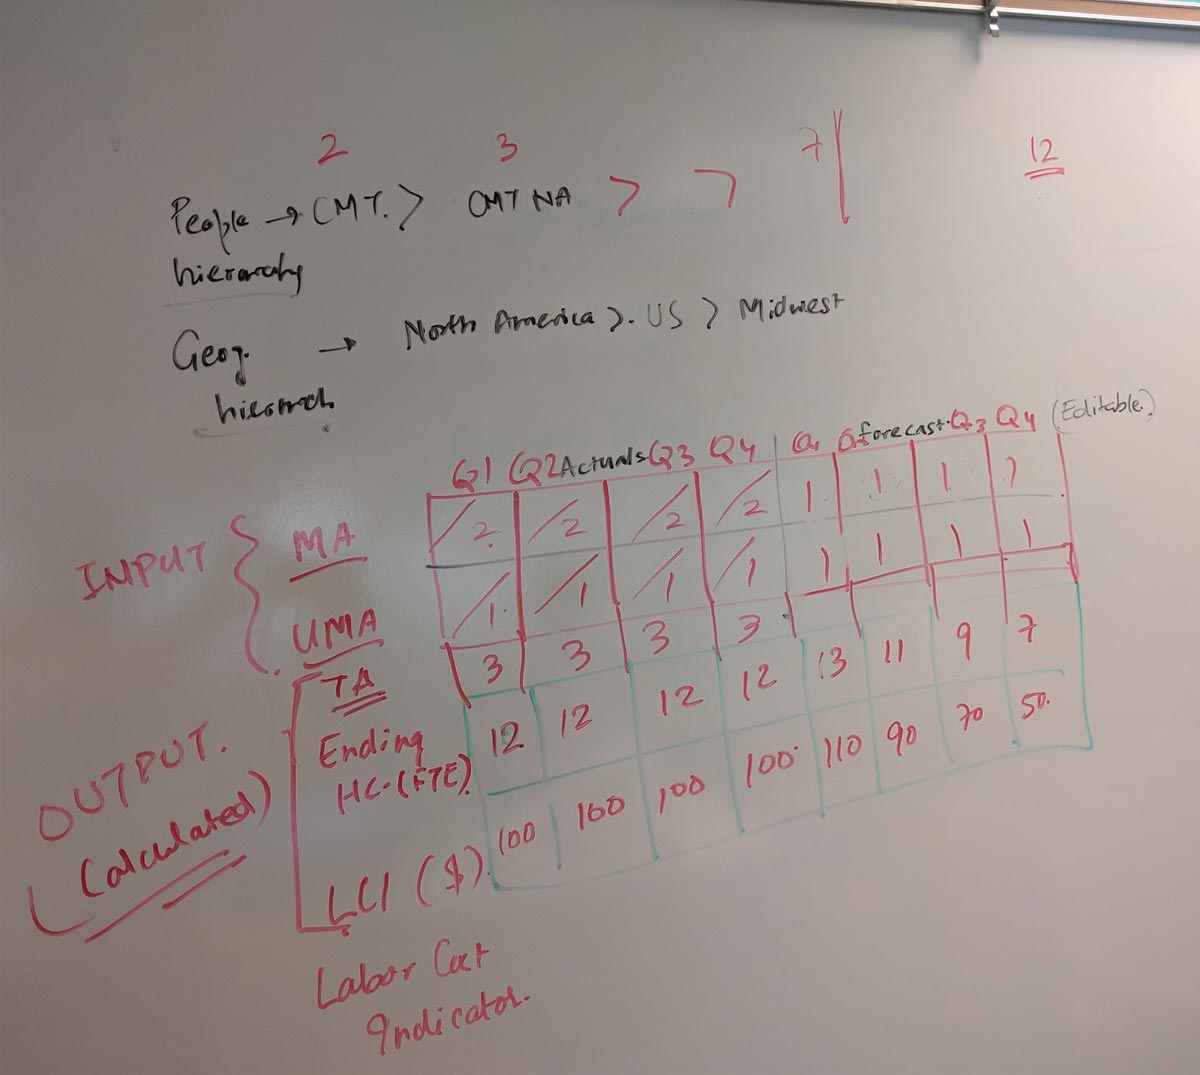
Overarching pain point themes
- Lack of a single source of truth
- No standardization for forecasting calculations
- Lack of awareness in regards to upstream and downstream impacts
- Inability to learn from historicals data or trends to inform current modeling or future forecasting
Current Offline Process
The current business process is dependent on individual offline Microsoft Excel files with no central organization. Users must enter data at the most granular level and then manually roll up their numbers to analyze trends. There is no central respository of data or reports, making communication between teams and management difficult.
UX Approach to Understanding Business Process
I collaborated closely with the product team in daily design sprints. The product team and I worked closely during the discover and scoping phases. It was very much a collaborative team effort which empowered rapid design validation from the stakeholder group.
Stakeholder Champions
Our working group of SMEs consisted of all known user types across the global business. The working group was instrumental in being able to perform research interviews and validate design direction.
In order to understand the current process, I held recorded talk aloud sessions with HR analysts outside of the initial SME group. These sessions confirmed targeted user pain points, process issues as well as built relationships across the business which enabled buy in. These sessions were the first introduction to a user centric approach for almost every team member.
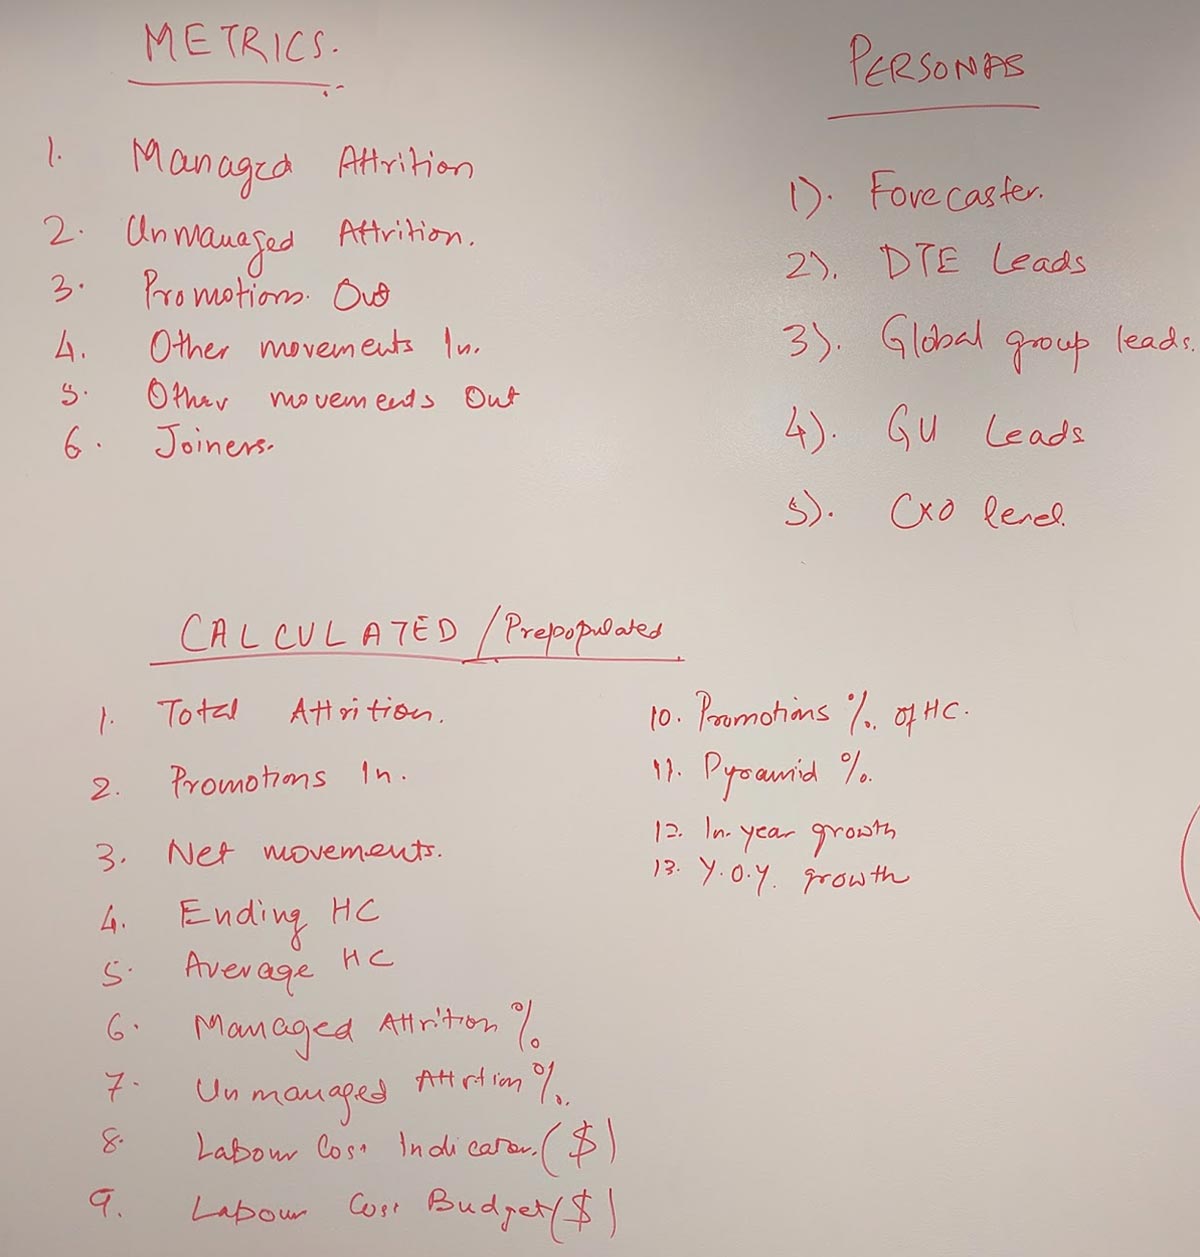
I then created a visual taxonomy of known functionality by view to scope the experience and gain alignment for the roadmap. This document was leveraged for sprint planning and prioritization.
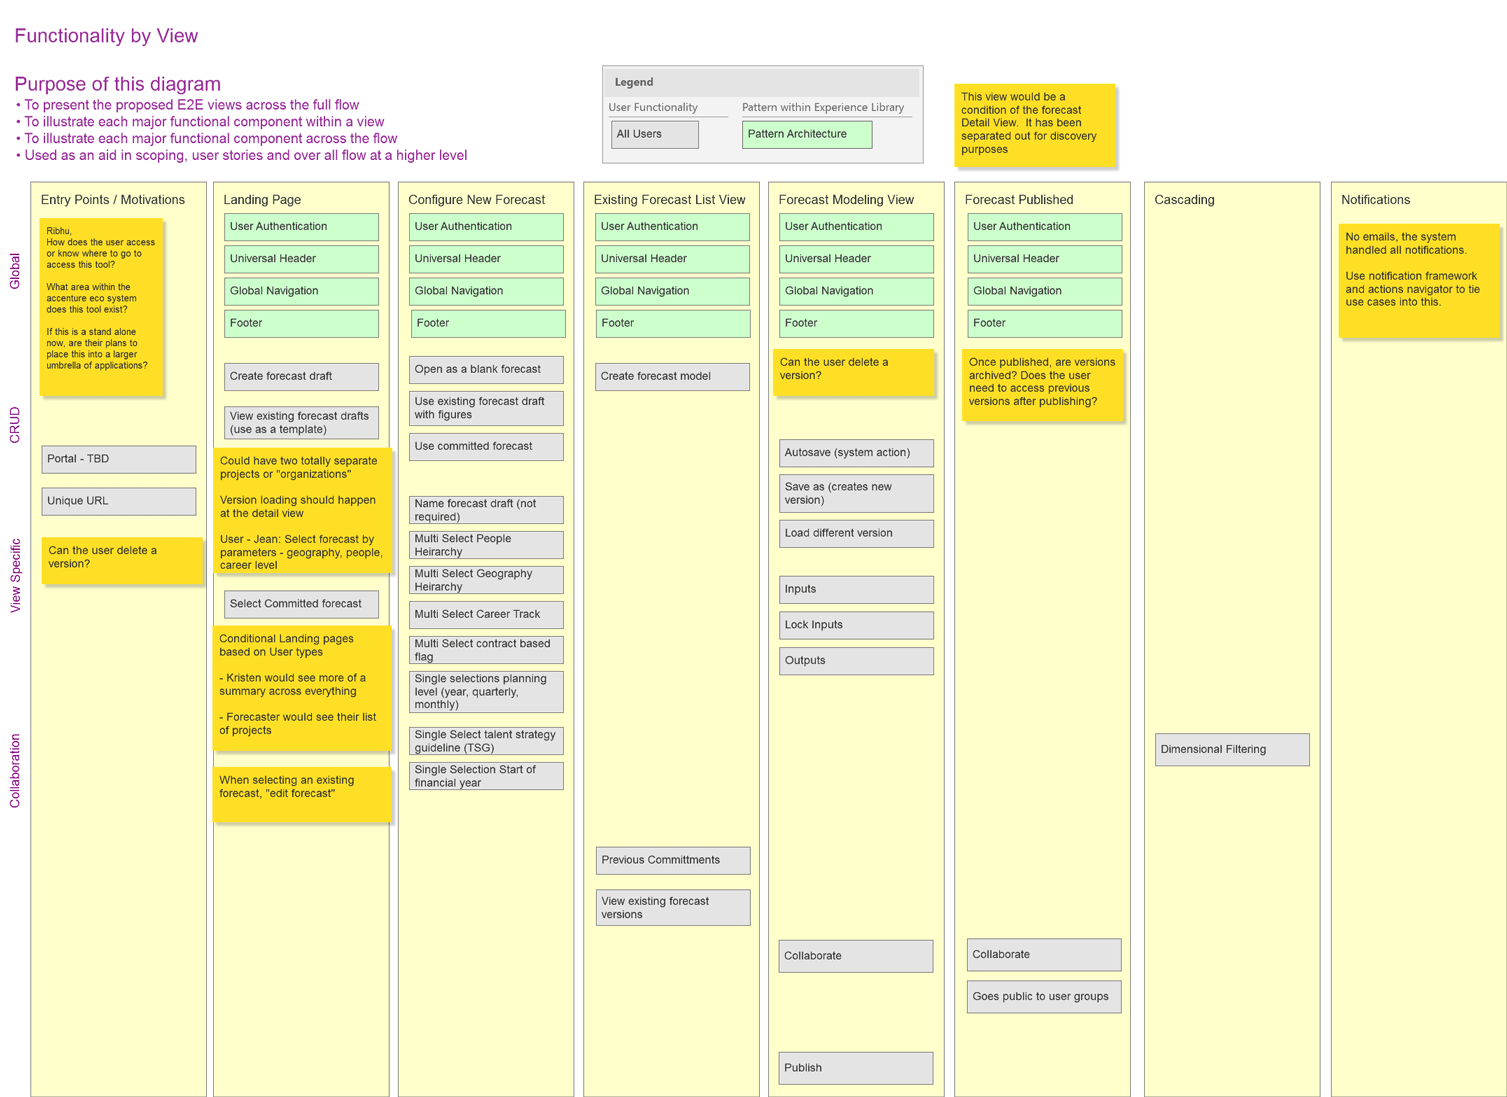
I worked in lock-step with the product team to ensure the end to end design tracked against the user stories on a daily basis.
Design Strategy
Due to the size and complexity of the business challenge, we held daily design sessions. These meetings were imperative to ramping up on the current business processes as well as aligning on proposed enhancements or design direction updates. During these workshops, we white boarded flows, technical constraints and UX storyboards and conditions. Our design workshops were instrumental in being able to rapidly discover, define, align and iterate while defining the experience as this new business process.
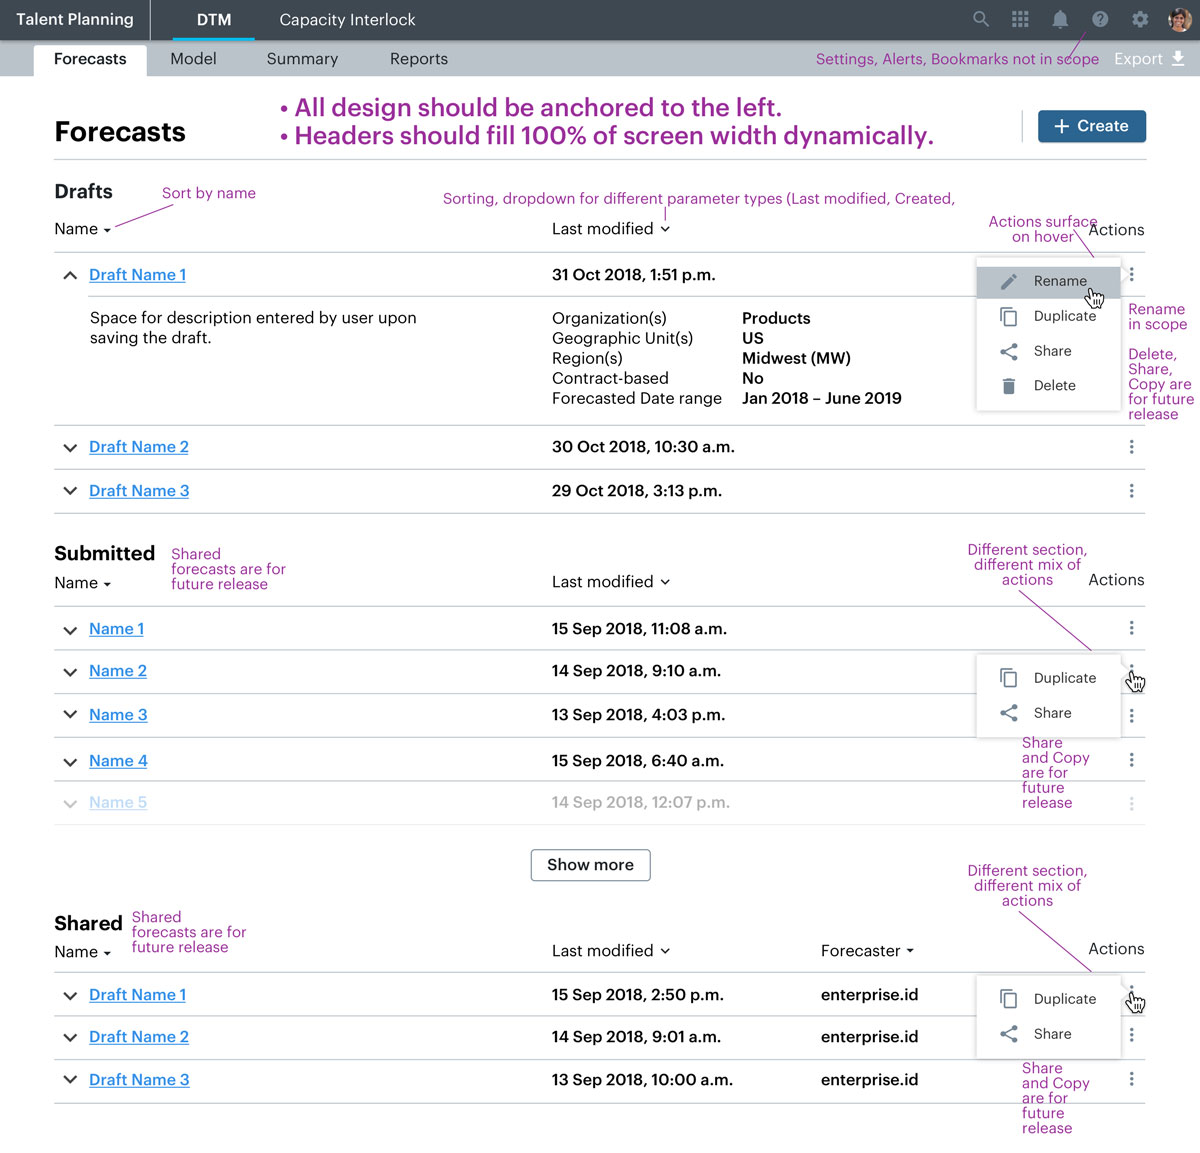
Landing Page & Universal Header
The user user can configure a new forecast draft, share their work with colleagues or edit an existing strategy. Like all other views, the landing page was blocked out using a combination of white board sessions, Axure and lastly Sketch to add polish to aligned flows and IA.
First step was to identify all the functionality on the homepage and block out the IA.
I started off by identifying the known functionality and then categorizing and chunking those features out into views across the flow.
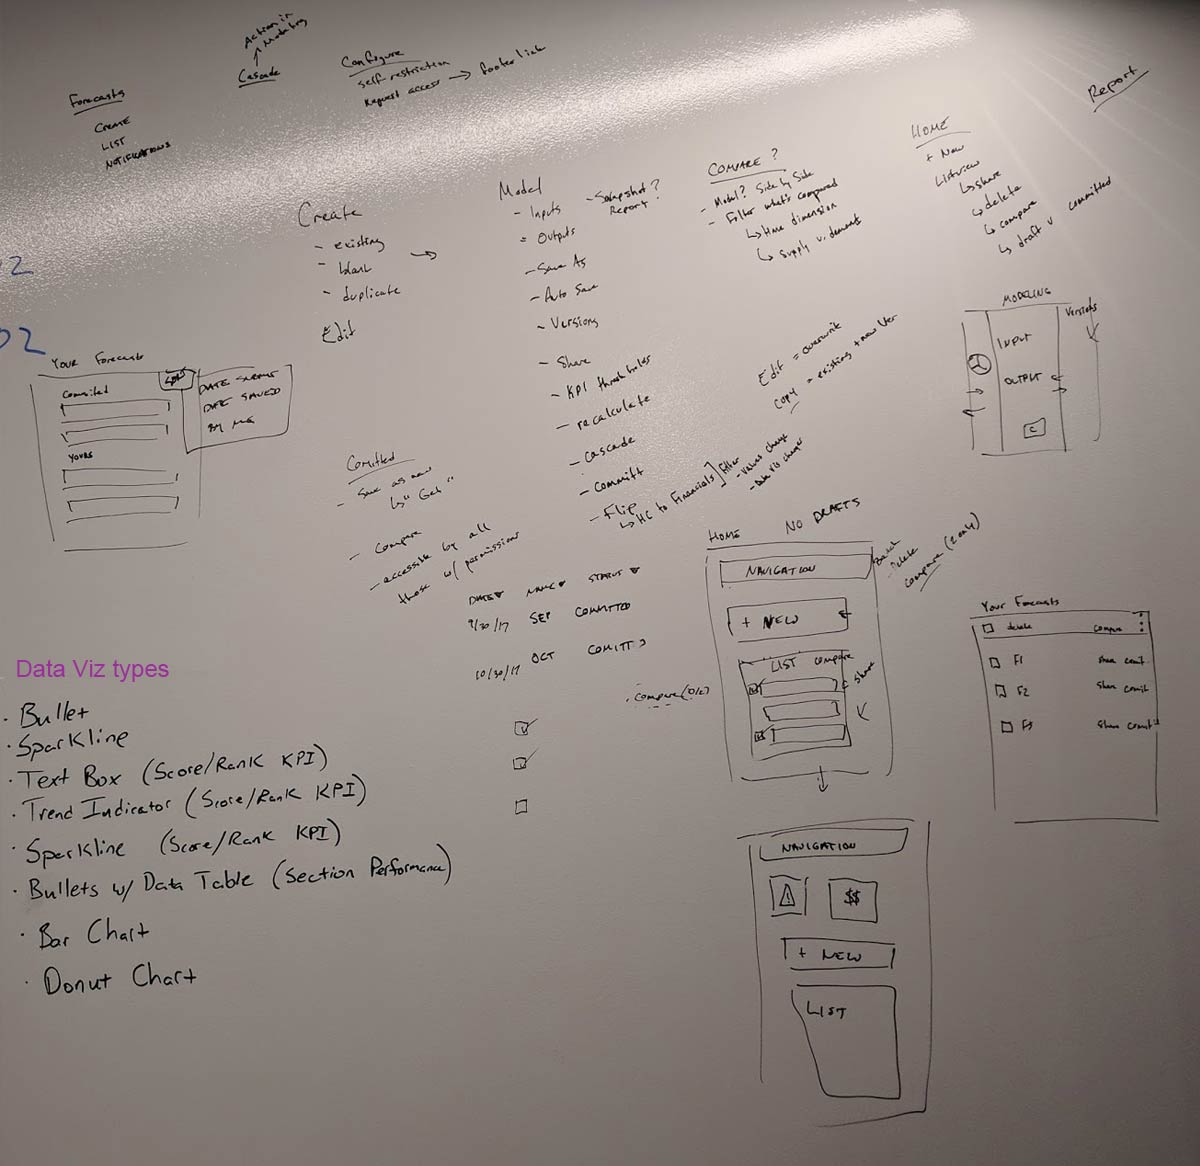
Homepage landing - creation and collaboration explorations.
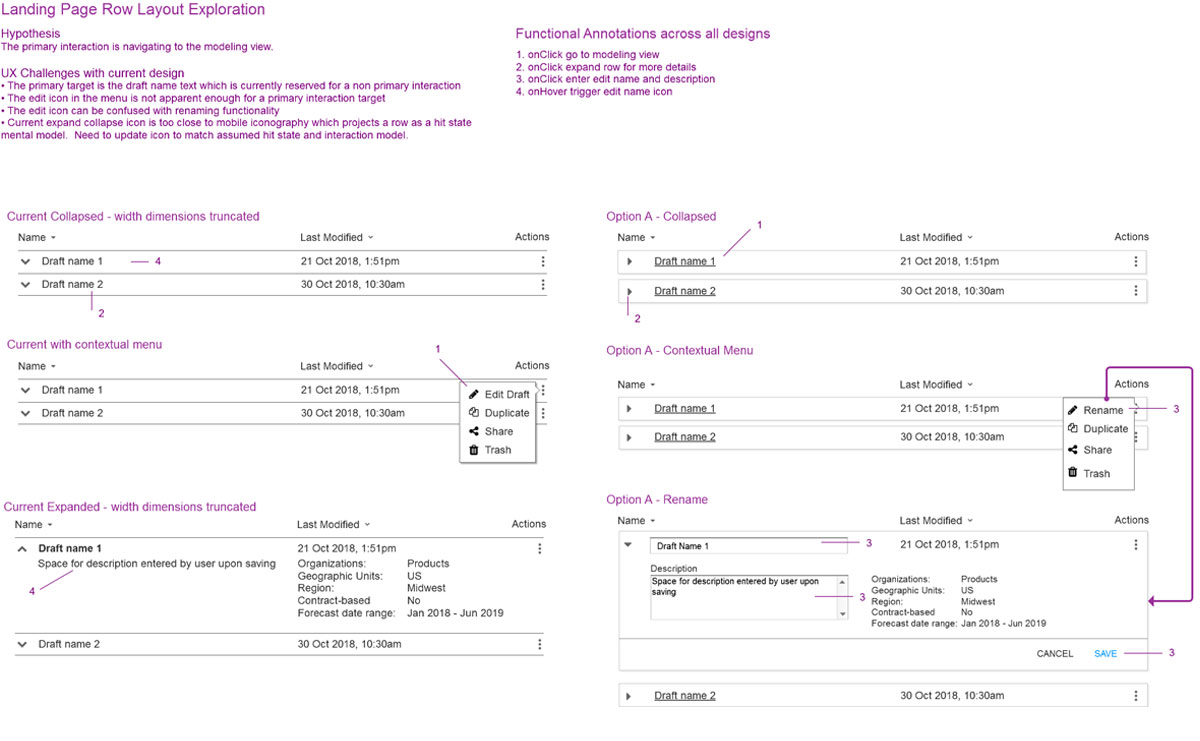
Once a direction was validated, medium fidelity views were created in Sketch.
At this point, I moved into Sketch and started creating a re-useable pattern library for this project which later fed into a separate design system workstream.
Forecast Draft Configuration
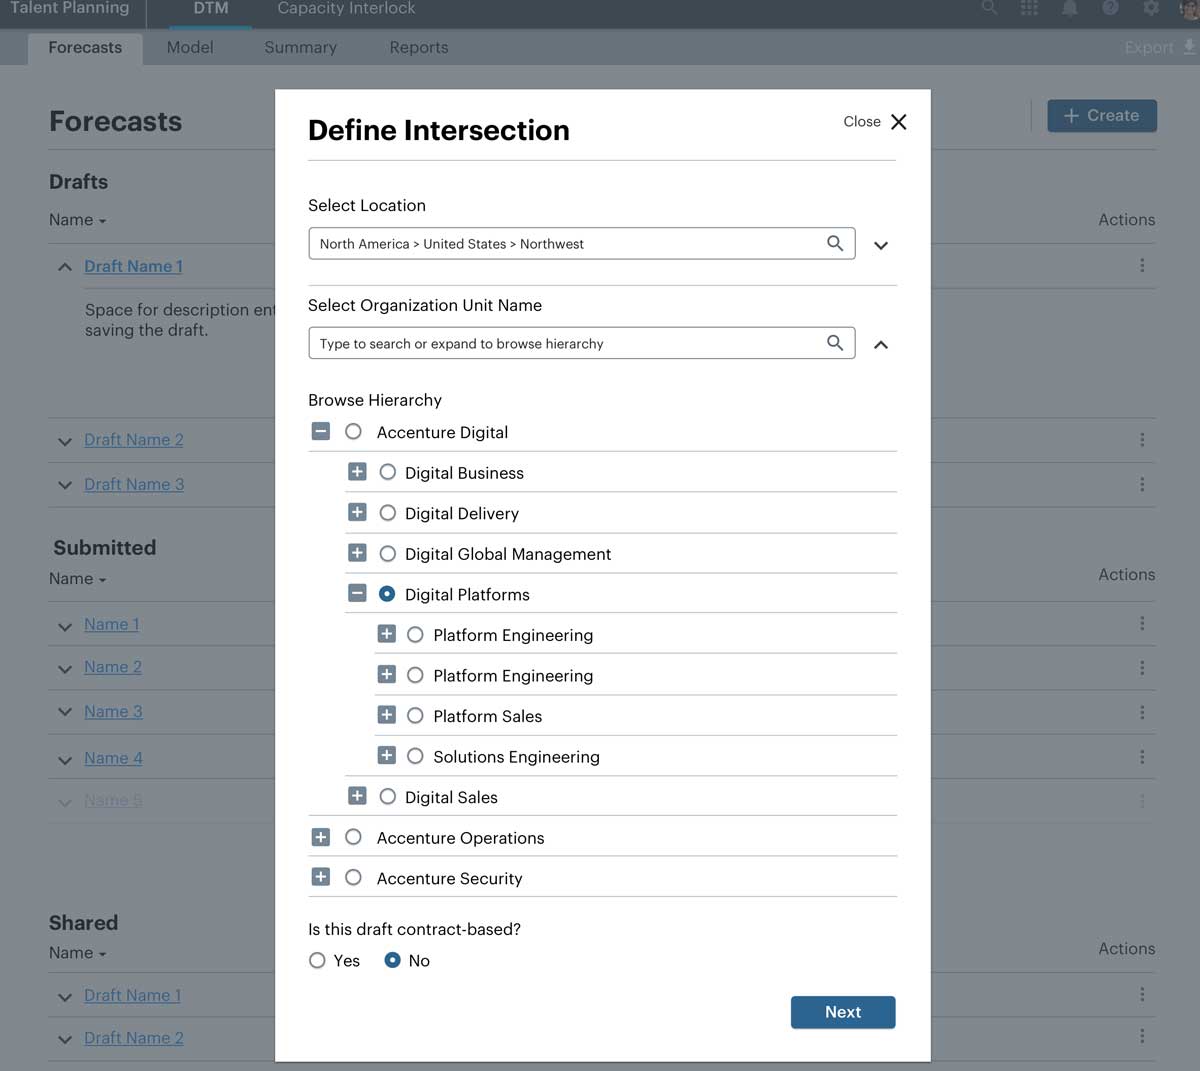
The main challenge with configuring a forecast was giving users the ability to quickly find elements within nested hierarchies. The number of possible intersections between the two data sets (geography and organization) numbered well over the thousands. This configuration user flow was used to confirm the design direction and led to the creation of a hierarchical browse and search pattern within the UX team's enterprise design system.
Evolution of the Create Forecast Experience
These views started as low fidelity wires to ensure alignment. Once validated with the team and SME group, wires were converted into higher fidelity sketch designs.
Users define the foundational elements of location and business organization
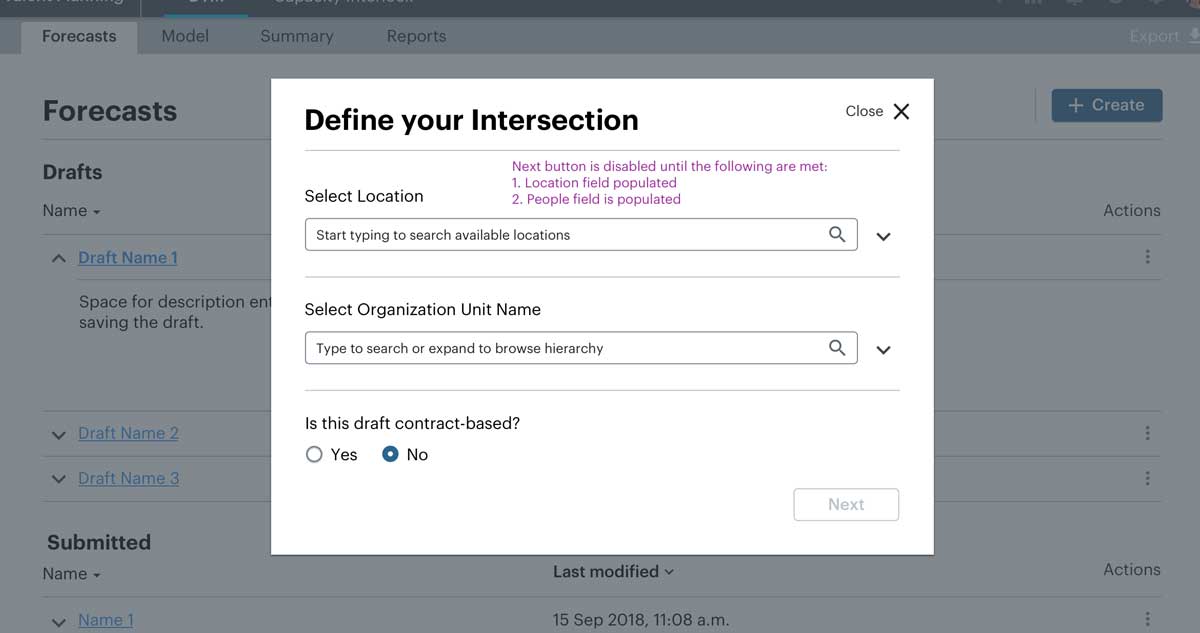
Users can search or browse the heirarchy to define the location, organization and capability intersection
Modeling View - Input View
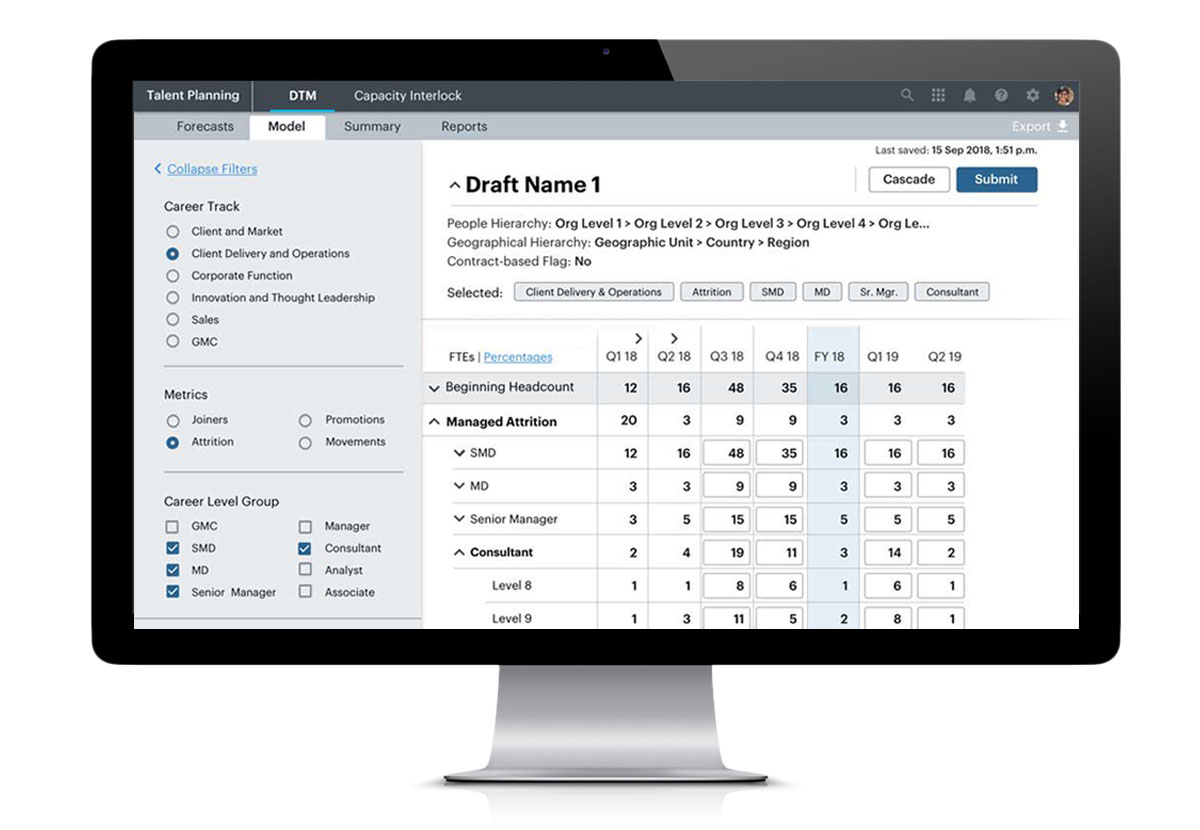
Once users successfully create a Forecast configuration, s/he will be presented with the modeling view in which data entry can occur.
UX Challenge - Behavioral Changes
One of the major challenges early on was to break away from the current behavior in which users thought they needed to see everything at once. I knew that users were most likely focusing on a few data points amongst their noisy crowded spreadsheets.
I iteratively interviewed the SMEs to understand the micro processes which informed their next steps as they worked across their tasks. I held talk aloud UXR sessions to understand exactly how they move from one flow to another.
- Users were realizing the majority of their work was muscle memory and they didn't need to see everything at once
- A clear pattern started to emerge across all the SMEs in how they navigated their files.
- SMEs and stakeholders were not more excited and aligned with what we were designing and proposing to the business at large.
The 'Aha!' Moment during User Research
Once I had identified a set of work flow patterns from SME interviews, I was able to chunk out a guided workflow. The users were so ingrained with Excel's ability to present everything at once that it was difficult to get the group on board with a more streamlined vision. Once the pattern was identified, it was separated out into steps and functions within the modeling view. Users were creating personalized filters within excel without realizing it.
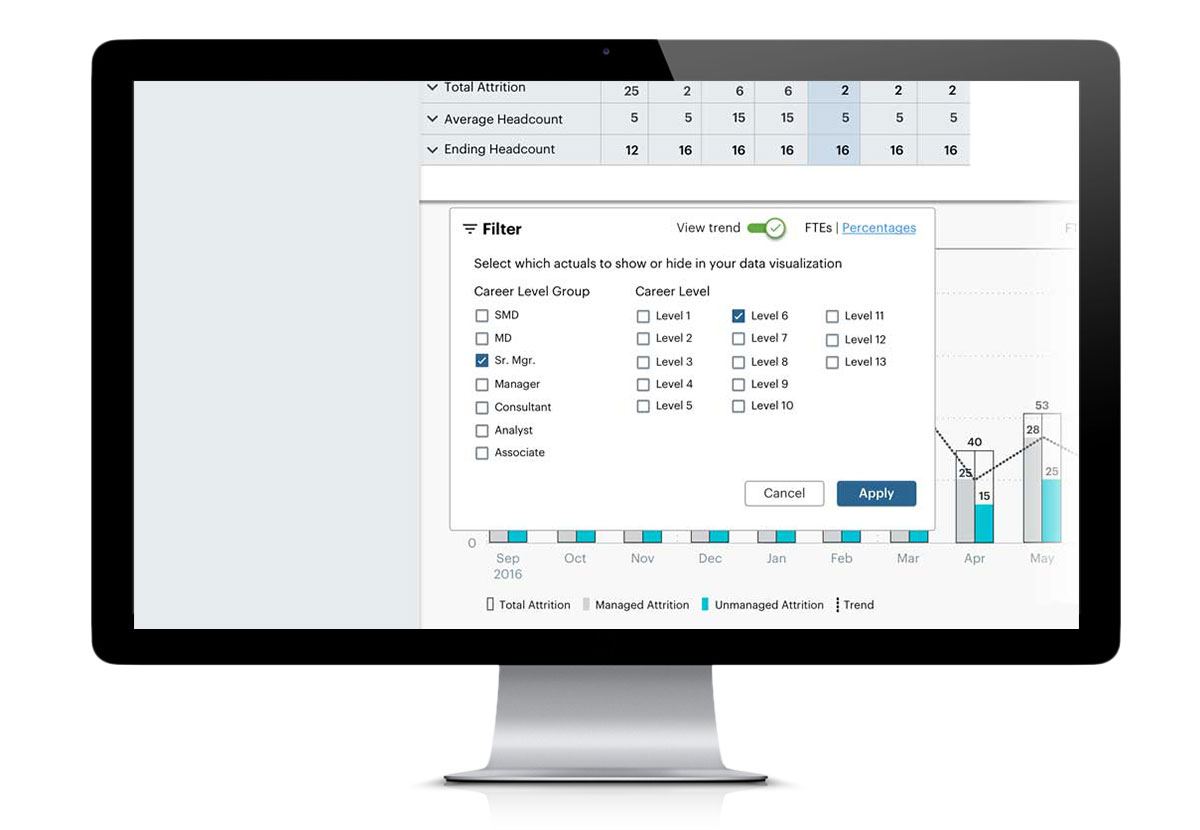
The data visualization component was anchored to the bottom of the view port.
- Allows the user to show or hide the trend charts for reference as needed
- Reduces the amount of scrolling while the user enters data (either using the mouse or tabbing through form inputs).
- Follows the mental model for left to right reading in which the user interacts with the top first, then can view trends below.
Ending Thoughts
The design process was a great success. This project was the first time the product and business teams worked with a UX design cell. The business and product teams included me early and often throughout the process which greatly increased morale, ideation and the overall success of the project.